matplotlib
公式HP:https://matplotlib.org/
Matplotlibは、プログラミング言語Pythonおよびその科学計算用ライブラリNumPyのための グラフ描画ライブラリである。 オブジェクト指向のAPIを提供しており、様々な種類のグラフを描画する能力を持つ。 描画できるのは主に2次元のプロットだが、3次元プロットの機能も追加されてきている。 描画したグラフを各種形式の画像(各種ベクトル画像形式も含む)として保存することもできるし、 wxPython、Qt、GTKといった一般的なGUIツールキット製のアプリケーションにグラフの描画機能を 組みこむこともできる。 MATLABの対話環境のようなものを提供するpylabというインタフェースも持っている。 Matplotlibは、BSDスタイルのライセンスの下で配布されている。
ネット上にある参考になりそうなサイト一覧
- Pyplot tutorial(公式)
- YutaKaのPython教室 Matplotlib 軸周り完璧マスターガイド | 軸・軸目盛・目盛り線の設定
- matplotlibのめっちゃまとめ - Qiita
- matplotlibでのプロットの基本 - Qiita
- matplotlibの描画の基本 - figやらaxesやらがよくわからなくなった人向け - Qiita
- [python] matplotlib.pyplotの挙動がわかり始めたメモ - Qiita
※データの可視化ライブラリとして「Bokeh」というものある。 2013年初リリースでmatplotlibと比べると新しいライブラリになる。 これはインタラクティブなデータ可視化ライブラリで、 便利そうなのだが、pandasとの連携がどのようになっているのかが把握できていない。
matplotlibのグラフ作成方法(pltとaxオブジェクト)
matplotlibでグラフを作成する方法は大きく分けて2通りあり、 「pyplot[plt.plot()]」か「ax.plot()」を用いるかのどちらかである。 どちらも一長一短があり、plt.plot()は手軽にグラフが作れるが細かい設定が面倒である。 一方のax.plot()は細かい設定が可能だがオブジェクトを積み重ねる必要があり、 慣れるのに時間を要するかもしれない。 (さまざまなオブジェクトを覚えるのが大変である。 軸のオブジェクトはどれだっけ?とか目盛の位置変えるにはどうすればいいんだっけ?など 正直覚えきれない。必要に応じて公式のサンプルコードやネットの海を漂う事になるだろう。)
まずは、plt.plot()でグラフを書いてみる。
import matplotlib.pyplot as plt # pltが慣例

xlist = [1, 2, 3, 4, 5]
ylist = [3, 5, 7, 10, 14]

plt.plot(xlist, ylist)  # 線グラフのプロット
plt.show()              # 表示
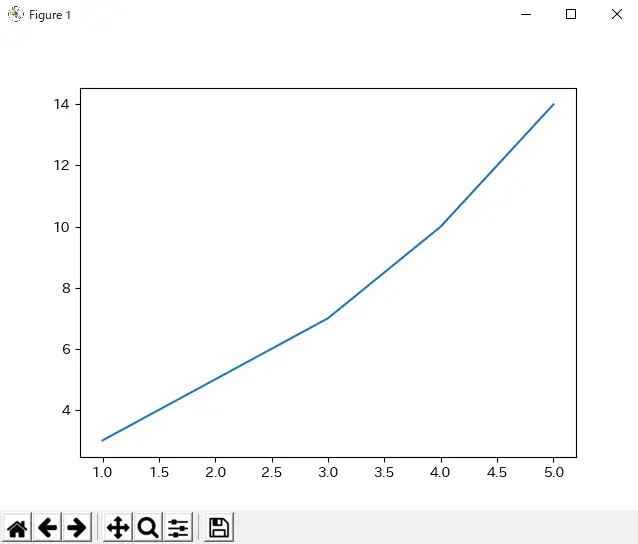
これだけで簡素なグラフであれば書ける。 6行目でplotし、7行目で下図のようなウィンドウを表示させている。
これにいろいろ付け足してみよう。
import matplotlib.pyplot as plt # pltが慣例

xlist = [1, 2, 3, 4, 5]
ylist1 = [3, 5, 7, 10, 14]
ylist2 = [4, 12, 9, 1, 2]

# 線グラフのプロット
plt.plot(xlist, ylist1, label='data1')
plt.plot(xlist, ylist2, label='data2')
plt.ylim(1, 15)                     # y軸目盛範囲設定
plt.xlim(1, 5)                      # x軸目盛範囲設定
plt.legend()                        # 凡例の表示
plt.grid(axis='x')                  # グリッド表示
plt.title('matplot sample plot')    # タイトル
plt.xlabel('x label')               # x軸ラベル
plt.ylabel('y label')               # y軸ラベル
plt.show()                          # 表示
#plt.savefig('output.png')          # 保存
もう少し詳しく見ていく。
plot()のパラメータ
plot()に渡せる引数は以下である。(全てではない一部である。) [ ]は別名でどちらを使っても良い。
plt.plot(
    xdata,
    ydata,
    color[c],       # 線の色
    linestyle[ls],  # 線の種類(点線・破線など)
    linewidth[lw],  # 線の太さ
    marker,         # マーカーの種類
    markersize[ms], # マーカーのサイズ
    label           # 凡例の名前(legend()で表示される)
    )
"color[c]"で使える色の名前は'b'、'g'、'r'、'k'などいろいろある。詳しくは下記のリンク先を参照せよ。
https://matplotlib.org/stable/gallery/color/named_colors.html
下記コードでは色の名前の一覧を表示している。 (GridSpecについては後述する。)
import matplotlib.pyplot as plt
import matplotlib.colors as mcolors
import matplotlib.patches as patches
from matplotlib.gridspec import GridSpec
from matplotlib.gridspec import GridSpecFromSubplotSpec as gsfss
import math

# 色の名前plot関数
def plot_text(ax, x, y, plot_str, rgb, fs):
    text_color = 'black'
    if sum(rgb)/3 < 0.20:
        text_color = 'white'
    ax.text(x+0.1, y, plot_str, va='top', c = text_color, size=fs)
    return ax

# 色plot関数
def plot_color(ax, color_dict, row_num, fs=10):
    y = 0
    x = 0
    for i, color_name in enumerate(color_dict):
        # 矩形plot
        rect = patches.Rectangle(xy=(x,y), width=1, height=-0.5, fc=color_name)
        ax.add_patch(rect)
        # color_dictの型判定
        if isinstance(color_dict[color_name], str):
            code_rgb_str = '\n{}'.format(color_dict[color_name])
            rgb = mcolors.to_rgb(color_dict[color_name])
        else:
            code_rgb_str = '\n({},{},{})'.format(*color_dict[color_name])
            rgb = color_dict[color_name]
        text = color_name.replace('tab:', '') + code_rgb_str
        plot_text(ax, x, y, text, rgb, fs)
        y -= 0.5
        if (i+1)%row_num == 0 and i != 0:
            x += 1
            y = 0
    ax.set_ylim(-row_num/2, 0)
    xlim_upper = math.ceil(len(color_dict)/row_num)
    ax.set_xlim(0, xlim_upper)
    ax.axis("off")
    return ax

figure = plt.figure(figsize=(15, 8))
gs_master = GridSpec(nrows=2, ncols=2)

gs1 = gsfss(nrows=1, ncols=1, subplot_spec=gs_master[0, 0])
gs2 = gsfss(nrows=1, ncols=1, subplot_spec=gs_master[0, 1])
gs3 = gsfss(nrows=1, ncols=2, subplot_spec=gs_master[1, 0:2])

ax1 = figure.add_subplot(gs1[:, :])     # gs_1の全体
ax2 = figure.add_subplot(gs2[:, :])     # gs_2の全体
ax3 = figure.add_subplot(gs3[:, :])     # gs_3の全体

ax1 = plot_color(ax1, color_dict=mcolors.BASE_COLORS, row_num=4)
ax1.set_title('BASE COLOR, (RGB)')

ax2 = plot_color(ax2, color_dict=mcolors.TABLEAU_COLORS, row_num=5)
ax2.set_title('TABLEAU COLOR, (COLOR CODE)')

ax3 = plot_color(ax3, color_dict=mcolors.CSS4_COLORS, row_num=10, fs=8)
ax3.set_title('CSS COLOR, (COLOR CODE)')

plt.subplots_adjust(left=0.02, right=0.98, bottom=0.02, top=0.90)

#plt.savefig('matplotlib_colors.png')
plt.show()
色を名前で指定する以外にも、RGBもしくはRGBA形式で色を指定することができる。 (RGBは赤緑青の割合を指定する方式。RGBAはそれに加えて透過度を加えたもの。) RGBなら「color=(0.2, 0.4, 0.5)」などと書く。 RGBAなら透過度0.8とすれば「color=(0.2, 0.4, 0.5, 0.8)」となり要素数が4つになる。 また、16進数法で表すhexRGBカラーコードも使える。
"linestyle[ls]"で使える線の種類は 'solid'['-']、'dotted'['.']、'dashed'['--']、'dashdot'['-.']が名前で指定できる。 これら以外にも「linestyle=(offset,(on_off_seq))」で線の種類を定義できる。 offsetは何pt横にずらすのかを指定し、on_off_seqには(線1の長さ,空白1の長さ,線2の長さ,空白2の長さ,…)を書く。
https://matplotlib.org/stable/gallery/lines_bars_and_markers/linestyles.html
import matplotlib.pyplot as plt

STD_LINESTYLES = {
    'solid': '-',
    'dotted': '.',
    'dashed': '--',
    'dashdot': '-.'
}

MY_LINESTYLES = [
    (0, (1, 1)),
    (0, (4, 2)),
    (0, (4, 2, 2, 1)),
    (0, (10, 3, 4, 5, 6, 3)),
]

cnt = 0
for ls_name in STD_LINESTYLES:
    plt.plot([0, 1], [cnt, cnt], linestyle=ls_name, color='red')
    plt.text(0, cnt, ls_name, va='bottom')
    cnt += 1

for my_ls in MY_LINESTYLES:
    plt.plot([0, 1], [cnt, cnt], linestyle=my_ls, color='red')
    plt.text(0, cnt, my_ls, va='bottom')
    cnt += 1

plt.axis('off')
plt.show()
"marker"で使えるのは'o'、'.'、'v'、'+'などがある。 例のごとく公式を見た方が早い。
https://matplotlib.org/stable/gallery/lines_bars_and_markers/marker_reference.html
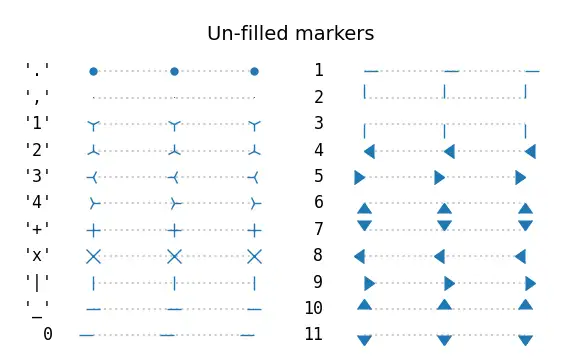
マーカーの例1
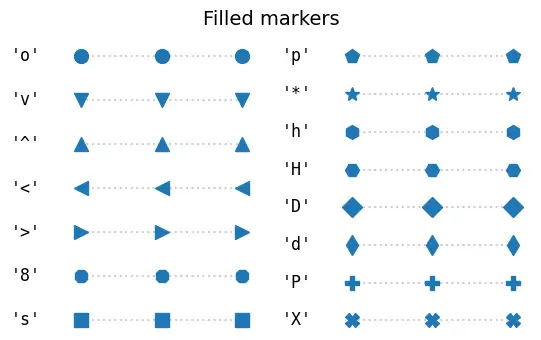
マーカーの例2
これ以外にもplot()に渡せる引数は存在するが、よく使うのは上記のものぐらいだろう。 というか、引数が多すぎて把握しきれない。
plot()は線グラフを書くが、これ以外にも分布図「scatter(x,y)」、※棒グラフ「bar(x,height)」、 ヒストグラム「hist(x)」、箱ひげ図「boxplot(X)」、円グラフ「pie(x)」などのグラフも書ける。
https://matplotlib.org/stable/plot_types/index.html
それぞれのグラフごとに渡せる引数も異なる(円グラフpie()にmarkerの指定はできないなど)が、 plot()の引数とさほど変わらないので調べれば問題なく使えるだろう。 (plot()とscatter()はほぼ同じである。plot()でマーカー指定し、 linewidthを0にすればそれはscatterと同じであろう。)
※棒グラフメソッドbar()には積み立て棒グラフを描く機能がデフォルトでは存在しない。 もし実装するなら自作することになる。 (pandasではパラメータ"stacked"をTrueにすれば積み立て棒グラフがすぐに使える。)
grid()のパラメータ
https://matplotlib.org/stable/api/_as_gen/matplotlib.pyplot.grid.html
plt.grid(
    visible=None,   # Trueで表示、Falseで非表示
    which='major',  # 'major' or 'minor' or 'both'
    axis='both',    # 'x' or 'y' or 'both'
    **kwargs        # colorやlinestyle、linewidthなどが設定可能
    )
グラフの保存
https://matplotlib.org/stable/api/_as_gen/matplotlib.pyplot.savefig.html
plt.show()でウィンドウが出るため、そのウィンドウから保存することもできる。 コードから保存するなら、plt.savefig(fname, format)で書くとよいだろう。 使えるフォーマット(拡張子)は 「eps」、「jpg」、「pdf」、「png」、「svg」、「tif」などである。
matplotlibでの日本語利用
matplotlibのデフォルトフォントは「sans-serif」であり、 このフォントには日本語がないので日本語を表示させようとすると文字化けする。 その為、デフォルトフォントを変更する必要がある。
毎回変更するのが面倒であればmatplotlibの設定ファイル(matplotlibrc)自体を 書き換えても良い。 matplotlibrcは"C:\Users\xxx\.matplotlib\matplotlibrc"のような場所に入っているはずである。
[参考] Matplotlibの設定ファイルmatplotlibrcとは?matplotlibrcはどこに置けば良い? | 似非プログラマの備忘録
import matplotlib.font_manager
import matplotlib.pyplot as plt

print('デフォルトのフォント', plt.rcParams['font.family'])
print('使用可能なフォント一覧')
print(matplotlib.font_manager.findSystemFonts())

xlist = [1, 2, 3, 4, 5]
ylist1 = [3, 5, 7, 10, 14]

# フォント読み込み
plt.rcParams['font.family'] = 'IPAexGothic' # 注

# 線グラフのプロット
plt.plot(xlist, ylist1, ls='--', label='データ1')

plt.legend()
plt.grid()
plt.title('matplotlib 日本語テスト')
plt.xlabel('x軸')
plt.ylabel('yじく')
plt.show()
12行目でフォントを読み込んでいる。 IPAフォントを利用しており、おそらくwindowsの中にはデフォルトでは入っていないだろう。 オープンソースのフォントであり使いやすいのでおすすめである。
https://moji.or.jp/ipafont/ipaex00401/
新しくフォントを入れるのが面倒であれば、 適当に「plt.rcParams['font.family'] = 'MS Gothic'」(Windowsなら)とでもしておけばよい。
Tex記法
matplotlibではTex記法で数式を書くことができる。
import matplotlib.pyplot as plt

xlist = [1, 2, 3, 4, 5]
ylist = [3, 5, 7, 10, 14]

# 散布図
plt.scatter(xlist, ylist)

plt.legend()
plt.grid()
plt.title(r'Tex Test $\Omega$')
plt.xlabel(r'$x$')
plt.ylabel(r'$\sin(x)$')
plt.show()
ドルマーク$で囲むと数式環境となり、Tex記法が使える。 またバックスラッシュはエスケープ対象なので、 文字列の前にrを書く必要があることに注意せよ。
オブジェクト指向を用いた書き方
細かい設定を行ったり、複数のグラフを並べて作成したときなどは オブジェクト指向で書いた方が分かりやすいかもしれない。 問題なのは、pltで書いたときと異なるメソッド名で呼び出さないといけなくなるものがあることである。 (plt.xlabel('x-axis')がax.set_xlabel('x-axis')に変わったりする。)
import matplotlib.pyplot as plt

x0 = [1, 2, 3, 4, 5]
y0 = [3, 5, 7, 10, 14]

x1 = [1, 2, 3, 4, 5]
y1 = [2, 4, 6, 8, 10]

fig = plt.figure()      # figureオブジェクト作成
ax = fig.add_subplot()  # figureオブジェクト内にaxオブジェクトを追加

ax.plot(x0, y0)         # axにplot
ax.plot(x1, y1)         # axにplot
plt.show()
上記の9~10行目は別の書き方もできて(1行で書くと)
fig, ax = plt.subplots()
matplotlibのオブジェクトの階層は下の図のようになっている。
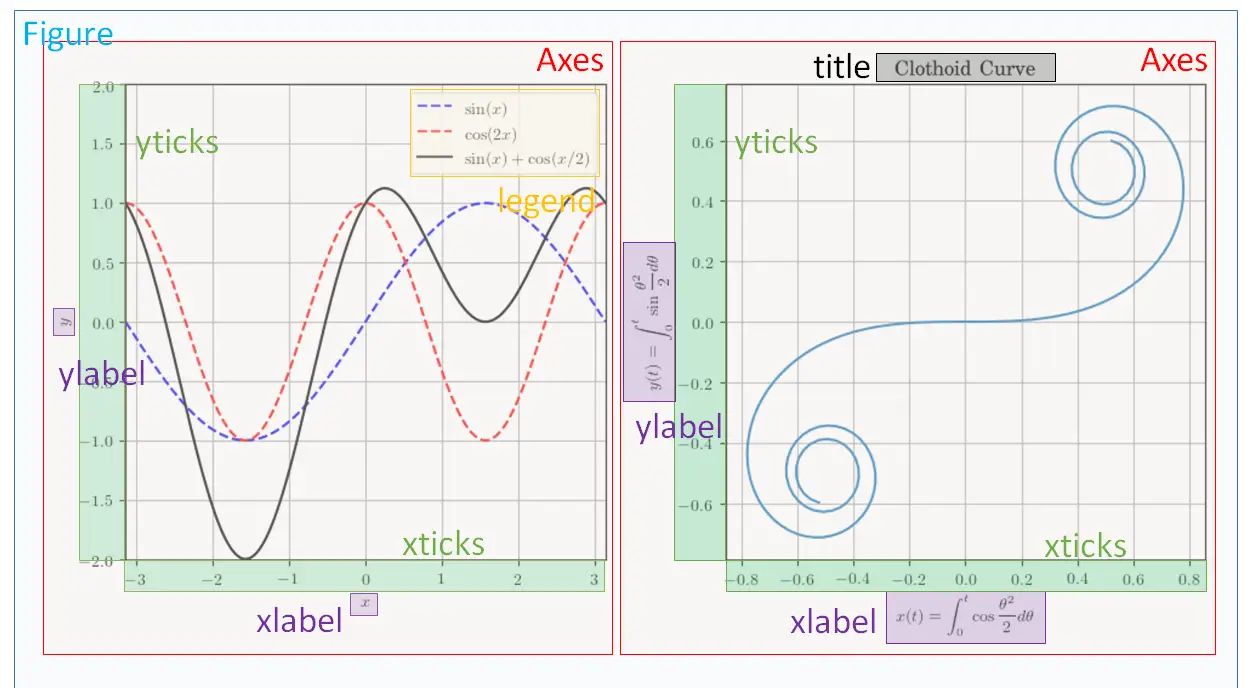
matplotlibのオブジェクトの階層
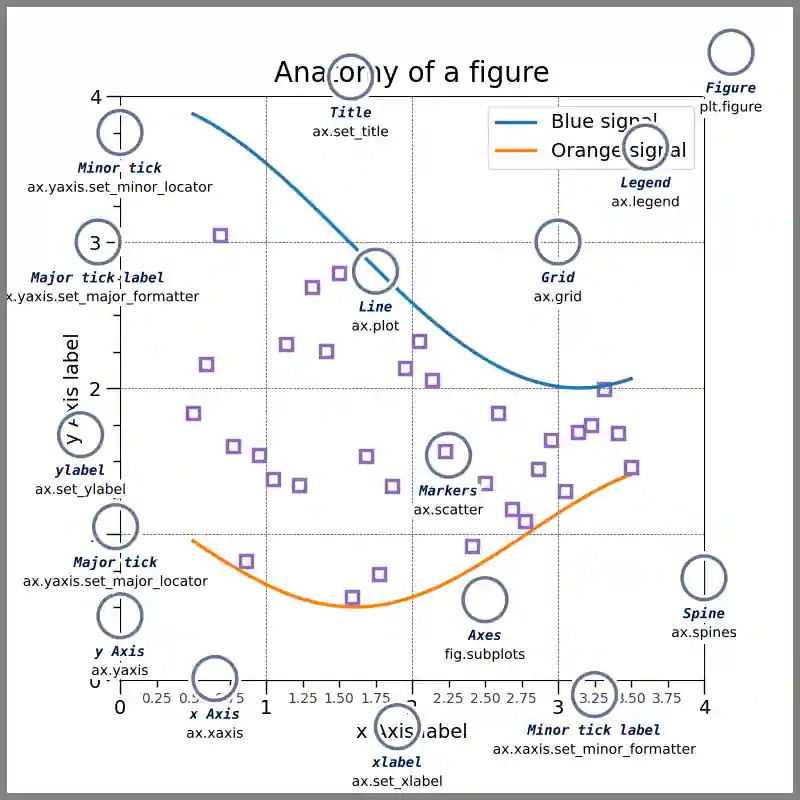
matplotlibのオブジェクトの構造
ここからはNumPyも用いつつ、上記のサンプルのように複数のグラフを並べて書く方法を紹介する。
import matplotlib.pyplot as plt
import numpy as np

x1 = np.linspace(0, 10, 100)
x2 = np.linspace(-10, 0, 100)
x3 = np.linspace(-5, 5, 100)

y1 = 2*np.sin(x1)
y2 = np.cos(2*x2)
y3 = 1 / (np.exp(-x3)+1)
y4 = 2**x1

fig = plt.figure()          # figure生成し変数figに格納(tight_layout=True)
ax1 = fig.add_subplot(221)  # figにaxを追加(nrows=2, ncols=2, index=1)
ax2 = fig.add_subplot(222)  # add_subplot(行数, 列数, 何番目か)
ax3 = fig.add_subplot(223)  # 2行、2列の3番目(左下に配置)

ax1.plot(x1, y1)                # ax1にx1,y1をプロット
ax2.plot(x2, y2)                # ax2にx2,y2をプロット
ax2.plot(x2, 2*np.sin(x2))      # ax2にx2,2sin(x2)をプロット
ax3.plot(x3, y3)                # ax3にx3,y3をプロット

#ax3の中にax3_insetを作成
ax3_inset = ax3.inset_axes([0.1, 0.1, 0.3, 0.3])
ax3_inset.plot(x1, y1)               # ax3にx1,y1をプロット

ax1.set_title("ax1 Graph")
ax1.set_xlim([0, 10])
ax1.set_ylim([-2, 2])

ax2.set_xlabel("ax2 xlabel")
ax2.set_ylabel("ax2 xlabel")

ax3.tick_params(
    direction='in',
    length=6,
    width=2,
    colors='r',
    grid_color='r',
    grid_alpha=0.5)

plt.show()
グラフ作成に関連するのは13行目からである。 14行目で「ax1 = fig.add_subplot(221)」とあるが、これはfigureの中に2x2のaxesオブジェクトを作り、 左上からインデックスが1,2…と振られるのだが、ここではindex=1をax1に代入している。 つまり、ax1は左上のグラフとなる。なお、"221"は二百二十一ではない。(2,2,1)でも良い。 同様にしてax2は右上のオブジェクトであり、ax3は左下のオブジェクトとなる。 2x2のaxesオブジェクトを作成しているため右下にもオブジェクトが作られるが、 今回は使わない(空白となる)。
18~21行目それぞれのaxesオブジェクトに対してplotをしている。 ax2はplot()を2回しているので線グラフが2つ重なる。
24・25行目はax3内にさらにaxesオブジェクトを追加している。 「inset_axes([x0, y0, width, height])」で表示位置と大きさを決めている。 (左下が(0,0)で右上が(1,1)とした相対位置を指定する。)
27行目以降はタイトル設定やラベル・目盛設定などを行っている。 なんとなく英語の意味でなにをやっている処理かは分かるであろう。
オブジェクト指向で書くと、オブジェクトの中にオブジェクトを入れる処理が書きやすくなる。 また、各オブジェクトに対して行う設定も分離して書けるため何をしている処理かが分かりやすい。
13~16行目の処理はsubplots()を使って別の書き方もできる。
import matplotlib.pyplot as plt
import numpy as np

x1 = np.linspace(0, 10, 100)
x2 = np.linspace(-10, 0, 100)
x3 = np.linspace(-5, 5, 100)

y1 = 2*np.sin(x1)
y2 = np.cos(2*x2)
y3 = np.sin(x3) + np.cos(2*x3)
y4 = 2**x1

# subplots利用(figure生成時に2次元配列でax領域を確保)
fig, axes = plt.subplots(2, 2)
axes[0, 0].plot(x1, y1)
axes[0, 1].plot(x2, y2)
axes[0, 1].plot(x2, 2*np.sin(x2))
axes[1, 0].plot(x3, y3)
ax3_inset = axes[1,0].inset_axes([0.1, 0.1, 0.3, 0.3])
ax3_inset.plot(x1, y1)

plt.show()
2軸グラフ
2軸グラフの例も紹介しておく。使うのは「ax.twinx()」である。
import matplotlib.pyplot as plt
import numpy as np

x1 = np.linspace(0, 10, 100)

y1 = 2*np.sin(x1)
y4 = 2**x1

fig = plt.figure()              # figure生成し変数figに格納
ax = fig.add_subplot(111)       # figにaxを追加
ax_ = ax.twinx()                # 右側の軸がy軸となるaxesオブジェクト生成
ax.plot(x1, y4, color="blue")
ax_.plot(x1, y1, color="red")
ax.set_yscale("log")
ax.tick_params(direction="in")

plt.show()
レイアウト GridSpec
「GridSpec」を用いると複雑なレイアウトも表現できる。
import matplotlib.pyplot as plt
from matplotlib.gridspec import GridSpec, GridSpecFromSubplotSpec

# テキストplot関数(中心配置)
def txtplot_center(ax, text, size=20):
    return ax.text(0.5, 0.5, text, size=size, ha='center', va='center')

# Figure作成
figure = plt.figure(figsize=(8, 8))

# Figureを3x3に分割
gs_master = GridSpec(nrows=3, ncols=3, height_ratios=[1, 1, 1])

# gs_masterの領域を配分
gs1 = GridSpecFromSubplotSpec(nrows=2, ncols=1, subplot_spec=gs_master[0:2, 0])
gs2 = GridSpecFromSubplotSpec(nrows=1, ncols=2, subplot_spec=gs_master[0, 1:3])
gs3 = GridSpecFromSubplotSpec(nrows=1, ncols=1, subplot_spec=gs_master[2, 0])
gs4 = GridSpecFromSubplotSpec(nrows=2, ncols=2, subplot_spec=gs_master[1:3, 1:3])

# subplotでaxオブジェクト生成
ax1 = figure.add_subplot(gs1[:, :])     # gs_1の全体
ax2 = figure.add_subplot(gs2[:, :])     # gs_2の全体
ax3 = figure.add_subplot(gs3[:, :])     # gs_3の全体
ax40 = figure.add_subplot(gs4[:, 0])    # gs_4の左側
ax41 = figure.add_subplot(gs4[:, 1])    # gs_4の右側

# 目盛り削除と軸範囲設定
for ax in figure.get_axes():
    ax.tick_params(bottom=False, labelbottom=False, left=False, labelleft=False)
    ax.set_xlim((0, 1))
    ax.set_ylim((0, 1))

# 文字列をプロット
txtplot_center(ax1, 'subPlot1')
txtplot_center(ax2, 'subPlot2')
txtplot_center(ax3, 'subPlot3')
txtplot_center(ax40, 'subPlot4-0')
txtplot_center(ax41, 'subPlot4-1')

plt.show()
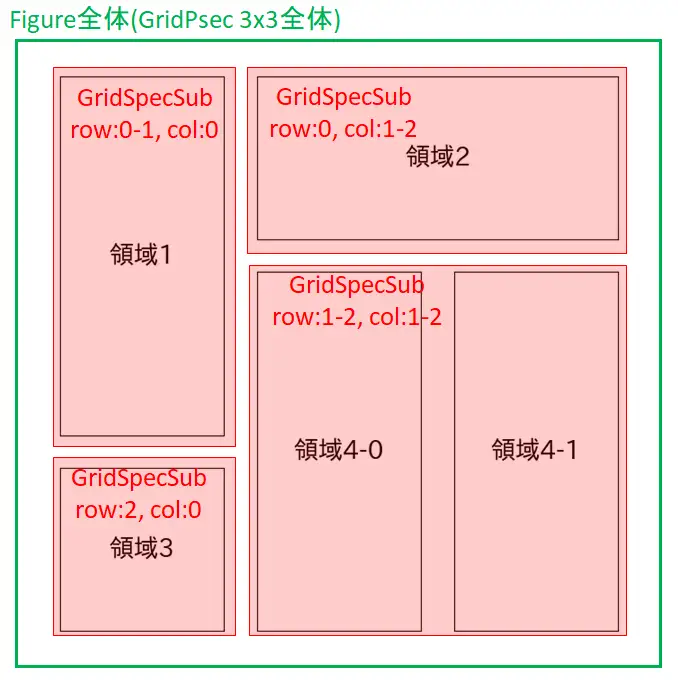
GridSpecでのレイアウト
seaborn使えば?と言われそうな応用
matplotlibを拡張したseabornパッケージには便利なものがいろいろ入っているが、 私的にはseaborn否定派なので頑張ってmatplotlibだけで書く。 やりたいのは、「sample_data2.txt」の可視化である。 なお、下記コードでは日本語化はmatplotlibrcファイルですでに行っているものとする。
import matplotlib.pyplot as plt
import numpy as np

# データ読み込み
path = 'sample_data2.txt'
data = np.loadtxt(path, delimiter='\t', dtype='object', encoding='utf8')

# 科目名取得(ヘッダー部分)
subject_names = list(data[0, 3:])
# データ取得(得点部分)
subject_data_list = [data[1:, col_idx].astype(np.int32) for col_idx in range(3, 8)]

# 近似直線用x
x = np.linspace(0, len(subject_data_list[0]), len(subject_data_list[0]))

# Figureと5x5のaxを作成
fig, axes = plt.subplots(5, 5)
fig.canvas.set_window_title('correlation')

# 縦:5回、横:5回繰り返してグラフ作成
for row_i, row_subject_data in enumerate(subject_data_list):
    for col_i, col_subject_data in enumerate(subject_data_list):
        ax = axes[row_i, col_i]
        ax.tick_params(direction='in')  # 目盛の方向を内側に設定
        ax.xaxis.set_visible(False)     # x軸とラベルを非表示に設定
        ax.yaxis.set_visible(False)     # y軸とラベルを非表示に設定
        ax.set_xlim([0, 100])           # x軸の範囲を設定
        # 位置によってプロット種類を変更
        if row_i == col_i:  # 対角線上のとき
            ax.hist(row_subject_data, bins=10)  # ヒストグラム生成
        else:               # 対角線上でないとき
            # 散布図生成
            ax.scatter(row_subject_data, col_subject_data, marker='.')
            # 線型近似の傾きaと切片b
            a, b = np.polyfit(row_subject_data, col_subject_data, 1)
            # 近似直線プロット
            ax.plot(x, a*x + b, c='r', ls='--')
            ax.set_ylim([0, 100])       # y軸の範囲を設定
        if col_i == 0:      # 0列目のとき
            ax.set_ylabel(subject_names[row_i]) # ラベルを科目名に設定
            ax.yaxis.set_visible(True)          # y軸を表示
        if row_i == 0:      # 0行目のとき
            ax.set_xlabel(subject_names[col_i]) # ラベルを科目名に設定
            ax.xaxis.set_label_position('top')  # ラベル位置を上部に設定
            ax.xaxis.tick_top()                 # x軸目盛り位置を上部に設定
            ax.xaxis.set_visible(True)          # x軸を表示

plt.show()
3次元グラフ
matplotlibでは3次元グラフも描ける。 「projection='3d'」としてやるとAxes3Dオブジェクトを返すようになる。 (matplotlibが新しいバージョンだと「from mpl_toolkits.mplot3d import Axes3D」いらないかも。)
from mpl_toolkits.mplot3d import Axes3D #省略可能かもしれないが、不安なので書いておく。
import matplotlib.pyplot as plt

fig = plt.figure()
ax = fig.add_subplot(111, projection='3d')
#fig, ax = plt.subplots(subplot_kw={'projection' : '3d'})

plt.show()
「plot(x, y, z)」で3次元曲線を描ける。
from mpl_toolkits.mplot3d import Axes3D
import matplotlib.pyplot as plt
import numpy as np

fig, ax = plt.subplots(subplot_kw={'projection': '3d'})

t = np.linspace(0, 20, 200) # パラメータ
x = np.sin(t) + t
y = np.cos(t)
z = t

ax.plot(x, y, z)
plt.show()
曲面を描くには格子点を生成する必要があり、それには「np.meshgrid(x, y)」を用いる。
from mpl_toolkits.mplot3d import Axes3D
import matplotlib.pyplot as plt
import numpy as np

fig = plt.figure()
ax1 = fig.add_subplot(121, projection='3d') # 1x2のax領域作成し、その1番目
ax2 = fig.add_subplot(122, projection='3d') # 1x2のax領域作成し、その2番目

def myfunc(X, Y):
    return 2*X*Y + X - 2*Y -1

x = np.arange(-5.0, 5.0, 0.5)
y = np.arange(-5.0, 5.0, 0.5)

X, Y = np.meshgrid(x, y)    # 格子点生成
Z = myfunc(X,Y)             # 関数適用

ax1.scatter(X, Y, Z, color='r', marker='.')             # 散布図
ax1.plot_wireframe(X, Y, Z, lw=0.4, color='g')          # ワイヤーフレーム

ax2.plot_surface(X, Y, Z, cmap='plasma', facecolor='w') # 曲面

plt.show()
アニメーション
matplotlibでアニメーションを作成するには、 「ArtistAnimation」か「FuncAnimation」のどちらかを用いる。 ArtistAnimationはあらかじめ図を作成した後、それらを連続で表示させることで アニメーションを作成する。 一方のFuncAnimationは逐次的に図の作成と表示を行うことでアニメーションを作成する。 ArtistAnimationは比較的わかりやすく書けるのだが、事前に画像を用意する必要があるため 画像数が多くなると動作が重くなる可能性がある。 一方のFuncAnimationは動作は軽いが、習得難易度が高めという特徴がある。
ここでは、FuncAnimationのコードを紹介して終わる。 下記はmatplotlibライブラリの他に「psutil」という外部ライブラリを用いて、 CPUの使用率とメモリ使用率・インターネット受信速度をリアルタイム表示するプログラムである。
import matplotlib.pyplot as plt
from matplotlib.gridspec import GridSpec, GridSpecFromSubplotSpec
from matplotlib.animation import FuncAnimation
import numpy as np
import psutil                   # CPUやメモリ、通信状態取得用
from collections import deque   # キュー作成用

def queue_push(que, x):
    que.append(x)
    que.popleft()
    return que

# テキストplot関数(中心配置)
def txtplot_center(ax, text, size=20):
    return ax.text(0.5, 0.5, text, size=size, ha='center', va='center')

# Figure作成
figure = plt.figure(figsize=(8, 8))

# Figureを3x3に分割
gs_master = GridSpec(nrows=3, ncols=3, height_ratios=[1, 1, 1], hspace=0.4)

# gs_masterの領域を配分
gs1 = GridSpecFromSubplotSpec(nrows=2, ncols=1, subplot_spec=gs_master[0:2, 0])
gs2 = GridSpecFromSubplotSpec(nrows=1, ncols=2, subplot_spec=gs_master[0, 1:3])
gs3 = GridSpecFromSubplotSpec(nrows=1, ncols=1, subplot_spec=gs_master[2, 0])
gs4 = GridSpecFromSubplotSpec(nrows=2, ncols=2, subplot_spec=gs_master[1:3, 1:3])

# subplotでaxオブジェクト生成
ax1 = figure.add_subplot(gs1[:, :])     # gs_1の全体
ax2 = figure.add_subplot(gs2[:, :])     # gs_2の全体
ax3 = figure.add_subplot(gs3[:, :])     # gs_3の全体
ax40 = figure.add_subplot(gs4[:, 0])    # gs_4の左側
ax41 = figure.add_subplot(gs4[:, 1])    # gs_4の右側

ax2.set_title('CPU Percent %')
ax2.set_xlim(-60, 0)
ax2.set_ylim(0, 100)

ax3.set_title('Internet Speed')
ax3.set_ylabel('Kbps')
ax3.set_xlim(-60, 0)
ax3.set_ylim(0, 1024)

ax40.set_title('Memory Percent %')
ax40.set_xlim(-60, 0)
ax40.set_ylim(0, 100)

x2 = np.arange(-60, 0, 1)
y2 = deque([0]*60)
y3 = deque([0]*60)
y4 = deque([0]*60)

my_line2, = ax2.plot([], [], c='b')
my_line3, = ax3.plot([], [], c='k')
my_line40, = ax40.plot([], [], c='r')
kbps_q = deque([0] * 2)
kbps = psutil.net_io_counters().bytes_recv/1024
kbps_q[0] = kbps

def update(i):
    global x2, y2, y3, y4, kbps_q
    cpu = psutil.cpu_percent()
    memory = psutil.virtual_memory().percent
    y2 = queue_push(y2, cpu)
    y4 = queue_push(y4, memory)
    my_line2.set_data(x2, y2)
    kbps_q = queue_push(kbps_q, psutil.net_io_counters().bytes_recv/1024)
    if kbps_q[1]-kbps_q[0] > 1024:
        ax3.set_ylabel('Mbps')
        mbsp = (kbps_q[1]-kbps_q[0]) /1024
        y3 = queue_push(y3, mbsp)
    else:
        ax3.set_ylabel('Kbps')
        y3 = queue_push(y3, kbps_q[1]-kbps_q[0])

    my_line3.set_data(x2, y3)
    my_line40.set_data(x2, y4)
    #print(i, cpu, kbps_, memory)

anim = FuncAnimation(figure, update, interval=500)
plt.show()
上記コードでは前述したGridSpecのレイアウトを用いた。
「ArtistAnimation」と「FuncAnimation」
波束の時間変化のアニメーションをArtistAnimationとFuncAnimationで実装してみる。 波束を複素指数関数で \begin{align} \psi(x,t)=\sqrt{\frac{1}{\sqrt{2\pi}\sigma(1 + it/\sigma^2)}} \exp\left[{\frac{-x^2/4\sigma^2+i(kx-\omega t)}{1 + it/\sigma^2}}\right] \end{align} と表せたとする。 ここで\(\omega\)は分散関係\(\omega=k^2\)が成り立ってるとすると \begin{align} \psi(x,t)=\sqrt{\frac{1}{\sqrt{2\pi}\sigma(1 + it/\sigma^2)}} \exp\left[{\frac{-x^2/4\sigma^2+i(kx-k^2t)}{1 + it/\sigma^2}}\right] \end{align} と書ける。
コードでは\(k=7,\sigma=0.7\)として上記の関数の実部を実装することにする。 まず、FuncAnimationでの例を紹介する。
'''
波束の時間変化グラフ描画
'''
import numpy as np
import matplotlib.pyplot as plt
from matplotlib.animation import FuncAnimation

# 波束関数
def f(x, t):
    k = 7
    s = 0.7

    A = 1 + 1j*t/s**2
    B = 1 / np.sqrt(np.sqrt(2*np.pi)*s*A)
    C = (-x**2/((2*s)**2) + 1j*(k*x-k**2*t)) / A

    return B*np.exp(C).real

# 更新用関数
def plot(i):
    # 前のフレームの描画をクリア
    ax.cla()
    # t=0のときの波束プロット
    ax.plot(x, f(x, 0), c='k', lw=0.9, ls='--')
    # 時間
    t = i * 0.05
    # 波束関数
    y = f(x, t)
    # 時刻tでの波束プロット
    ax.plot(x, y, c='r')
    # 時刻テキストプロット
    ax.text(35, -0.9, r'$t={:.1f}$'.format(t))
    # 軸範囲とラベル設定
    ax.set_xlim(-2, 40)
    ax.set_ylim(-1, 1)
    ax.set_xlabel(r'$x$')
    ax.set_ylabel(r'$\phi(x, t)$')
    ax.tick_params(axis='both', which='major', direction='in')

x = np.linspace(-2, 40, 400)
# figureとaxオブジェクト作成
fig, ax = plt.subplots()
fig.suptitle('The temporal changes of wave packets')
# 上下左右余白調整
plt.subplots_adjust(left=0.15, right=0.95, bottom=0.15, top=0.95)
# フレーム数40,、描画間隔100ミリ秒
anim = FuncAnimation(fig, plot, frames=40, interval=100)

plt.show()
ArtistAnimationでの例は以下である。
'''
波束の時間変化グラフ描画
'''
import numpy as np
import matplotlib.pyplot as plt
from matplotlib.animation import ArtistAnimation

# 波束関数
def f(x, t):
    k = 7
    s = 0.7

    A = 1 + 1j*t/s**2
    B = 1 / np.sqrt(np.sqrt(2*np.pi)*s*A)
    C = (-x**2/((2*s)**2) + 1j*(k*x-k**2*t)) / A

    return B*np.exp(C).real

x = np.linspace(-2, 40, 400)
# figureとaxオブジェクト作成
fig, ax = plt.subplots()
fig.suptitle('The temporal changes of wave packets')
# 上下左右余白調整
plt.subplots_adjust(left=0.15, right=0.95, bottom=0.15, top=0.95)
# 軸範囲とラベル設定
ax.set_xlim(-2, 40)
ax.set_ylim(-1, 1)
ax.set_xlabel(r'$x$')
ax.set_ylabel(r'$\phi(x, t)$')
ax.tick_params(axis='both', which='major', direction='in')
# t=0のときの波束プロット
ax.plot(x, f(x, 0), c='k', lw=0.9, ls='--')

# 1フレームごとのグラフ格納用リスト
artist_list = []
for i in range(40):
    # 時間
    t = i * 0.05
    # 波束関数
    y = f(x, t)
    # 時刻tでの波束プロット
    line, = ax.plot(x, y, c='r')
    # 時刻テキストプロット
    text = ax.text(30, -0.9, r'$t={:.1f}$sec'.format(t))
    # 波束プロットと時刻テキストプロットを格納用リストに追加
    artist_list.append([line, text])

# 描画間隔100ミリ秒
ani = ArtistAnimation(fig=fig, artists=artist_list, interval=100)

plt.show()
FuncAnimationはArtistAnimationよりも動作が軽いと紹介したが、 この波束アニメーションの例だとおそらく(実行環境にもよるが) ArtistAnimationの方がアニメーションが滑らかに動くと思われる。 ArtistAnimationは予め40個のグラフ画像を作成するため(36~46行のforの中身)、アニメーションの開始まで少し時間を要するが、一度作成してしまえばその後は滑らかに動かせる。(グラフ枚数が40枚程度なら問題なし。) 一方のFuncAnimationは更新用関数の中でax.cla()を行い、ラベルや軸範囲設定を毎回実行しているため、動作が重めになっている。